Difference between revisions of "Talk:2311: Confidence Interval"
m |
|||
| Line 5: | Line 5: | ||
:: Actually, if you [https://www.wolframalpha.com/input/?i=integrate+1%2Fsqrt%282+*+pi%29+*+exp%28-x%5E2+%2F+2%29+from++-0.001+to+0.001 integrate] a normal distribution <math>\mathcal{N}(0,1)</math> from <math>-\frac{\sigma}{1000}=-0.001</math> to <math>+\frac{\sigma}{1000}=0.001</math>, you'll get a range of about 0.08% of all values. This would be bad because it would mean that, as big as the confidence interval appears in the picture, the more meaningful 1- or 3-sigma interval (whose size represents the uncertainty of the model) would be larger by a factor of 1250 or 3750, respectively. --[[User:Koveras|Koveras]] ([[User talk:Koveras|talk]]) 08:38, 26 May 2020 (UTC) | :: Actually, if you [https://www.wolframalpha.com/input/?i=integrate+1%2Fsqrt%282+*+pi%29+*+exp%28-x%5E2+%2F+2%29+from++-0.001+to+0.001 integrate] a normal distribution <math>\mathcal{N}(0,1)</math> from <math>-\frac{\sigma}{1000}=-0.001</math> to <math>+\frac{\sigma}{1000}=0.001</math>, you'll get a range of about 0.08% of all values. This would be bad because it would mean that, as big as the confidence interval appears in the picture, the more meaningful 1- or 3-sigma interval (whose size represents the uncertainty of the model) would be larger by a factor of 1250 or 3750, respectively. --[[User:Koveras|Koveras]] ([[User talk:Koveras|talk]]) 08:38, 26 May 2020 (UTC) | ||
Can it be related to Covid19 pandemia and all those graphs that try to predict if it is in decline or not? [[User:Tkopec|Tkopec]] ([[User talk:Tkopec|talk]]) 08:27, 26 May 2020 (UTC) | Can it be related to Covid19 pandemia and all those graphs that try to predict if it is in decline or not? [[User:Tkopec|Tkopec]] ([[User talk:Tkopec|talk]]) 08:27, 26 May 2020 (UTC) | ||
| + | : No. But maybe it's related to the recent Mt. St. Helens comic... :p Seriously, not everything has to be related to the hot-button topic of the day. | ||
Revision as of 10:12, 26 May 2020
What's a millisigma? 162.158.107.209 03:31, 26 May 2020 (UTC)Ven
- Not an official scientific term - most likely referring to standard deviation. One standard deviation, or sigma, is the 68.3 % of values lying around the mean in a normal distribution. A millisigma in a standard deviation would be .0683 % of a normal distribution so that much variation would be bad? Not sure. 172.69.63.203 05:23, 26 May 2020 (UTC)
- Actually, if you integrate a normal distribution
 from
from 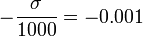 to
to 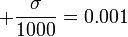 , you'll get a range of about 0.08% of all values. This would be bad because it would mean that, as big as the confidence interval appears in the picture, the more meaningful 1- or 3-sigma interval (whose size represents the uncertainty of the model) would be larger by a factor of 1250 or 3750, respectively. --Koveras (talk) 08:38, 26 May 2020 (UTC)
- Actually, if you integrate a normal distribution
Can it be related to Covid19 pandemia and all those graphs that try to predict if it is in decline or not? Tkopec (talk) 08:27, 26 May 2020 (UTC)
- No. But maybe it's related to the recent Mt. St. Helens comic... :p Seriously, not everything has to be related to the hot-button topic of the day.
