2599: Spacecraft Debris Odds Ratio
| Spacecraft Debris Odds Ratio |
 Title text: You say this daily walk will reduce my risk of death from cardiovascular disease by 30%, but also increase my risk of death by bear attack by 300%? That's a 280% increased! I'm not a sucker; I'm staying inside. |
Explanation
This comic is a misunderstanding of statistics very similar to that of 1252: Increased Risk. It suggests that going outside for more than 5 hours per day significantly increases your risk of head injury from falling spacecraft, and advises to limit outside activity to avoid this risk.
The data are apparently based on a Monte Carlo simulation, a computational method that uses input values randomly drawn from a given distribution and which repeats that calculation many times; the distribution of the outputs is then analyzed. This method is used to determine the possible outcomes (and their respective probabilities) for a given scenario. Basically, instead of doing hard math to calculate the outcomes you let a computer repeat the scenario for a huge number of different input values and watch what happens. In this case, the study might have consisted of defining the baseline probability of spacecraft debris falling from the sky in a given time frame (say, 1% every minute) as well as the probability that it is heavy enough to break through the roof (say, also 1%), translating this to the output of a random number generator (e.g. "1" means "space debris falls in direction of head and can break through the roof", 2-100 means "space debris falls in direction of head but can't go through a roof" and values 101-10000 mean "no danger from space debris"), adding another random number generator to simulate the distributions for "person is outside X hours of the day", then drawing numbers repeatedly from both distributions and calculating the outcome for each instance.
Doing a Monte Carlo simulation for a hypothetical and rare scenario like this can make sense: it is so rare for humans to be struck by spacecraft debris that an absurdly large sample size, involving tens of millions of participants over several decades, would be necessary to obtain significant experimental data. However, the statistical analysis and presentation of the data is horribly misleading and sensationalizing. The comic essentially pokes fun at the way that data can be misrepresented and exaggerated using an example that people would realize is absurdly unlikely.
The results are presented not as an overall probability but rather as an odds ratio of the probabilities. The odds ratio is defined as p(A happens in presence of B)/p(A happens in absence of B), which here would be p(space debris head injury after Xh spent outside and 24-Xh inside)/p(space debris head injury after 24h spent inside). The resulting value tells you how much more likely an outcome becomes if you do (or have) A. E.g. the bottom line of the graph in the comic means that spending 11+ hours outside will make it 3 times as likely to get a head injury from space debris compared to not being outside at all. However, while odds ratios can be useful they tend to hide the scale of a probability - e.g. 0.00000000002%/0.00000000001% = 2, the outcome became twice as likely but the probability only rose by 0.00000000001%. And since the odds of being hit in the head by (any part of) a falling spacecraft are astronomically (no pun intended) low to begin with, even quadrupling it still results in a negligible probability.
The choice of hour brackets instead of a linear time scale is suspicious. Monte Carlo simulations involve a huge number of computations; the scientists should have more than enough data to plot the odds ratio for every additional hour spent outside. Moreover, each hour bracket has a different size - why didn't they use a regular binning like e.g. 1-3, 4-6, 7-9, 10-12? One might suspect that they wanted to conceal inconsistencies and that the underlying data points by themselves don't look nearly as convincing. Moreover, range-based groups of any kind should never be analyzed as if they were independent categories. Spending 5 hours outside is not intrinsically different from spending 1 hour outside - the 5-hour-mark (presumably) doesn't suddenly turn humans into space-debris magnets. The likelihood of space debris falling down at any given moment stays the same and the cumulative (i.e. summed-up) probability should increase at a constant rate. Instead of comparing every hour bracket to the same baseline reference, each should each be compared to the next-lowest value.
The error bars (the lines extending from the points in the graph) are HUGE compared to the effect they measured. Error bars define the range in which the true value might be - here, for 2-4 hours the true value could be an increase by 2, or a small DEcrease of the probability.
The data are shown on a log scale. Logarithmic scales are used when you have both very small and very large values and want to depict their relative differences in a single plot without making the small values look like zero or cutting off the large values. The data shown here do not have huge differences - there is no good reason for using a log scale. However, the log scale is conveniently chosen to make the error bars look like they have the same length. They do not. The error bar for the last data point is actually twice as large as that for the first data point.
The title text continues the misuse of statistics by insinuating that a 30% decrease of cardiovascular disease resulting from going outside (and exercising) is outweighed by a simultaneous 300% increase of risk of being killed by a bear. As shown in 1102: Fastest-Growing, the percentage increase/decrease alone of something has little meaning; the context of the original size is needed to evaluate how impressive the change really is. And in this case, the probability of dying from a cardiovascular disease is much, MUCH higher than the probability of being attacked and killed by a bear, so the moderate decrease of the former has much more impact on one's overall life expectancy than even a huge increase of the latter (unless you live in an area that has many bears, in which case your best bet is to take appropriate precautions rather than to never go outside at all).
The "280% increase" of the title text is also an error, though perhaps not for reasons you might assume at first glance (the correct calculation is not "300% − 30% = 270%"). To "increase by 300%" means to add 300% on top of the original 100% (=400%, so multiplied by 4), while to "decrease by 30%" means to remove 30% from the original 100% (=70%, so multiplied by 0.7). Combining these (which is very very wrong!) would mean multiplying by both, for an overall change of 4.0 × 0.7 = 2.8, or 280%. However, this should be read as an increase to 280% of its old value, not by 280% (you started at 100% and added 180%). But this is a very, very wrong way of doing the math because these are probabilities of very different things with very different scales (if you threw out 30% of your dishware but in that same period also acquired 3 toothpicks on top of your original 1 toothpick, would you say that your kitchen stuff increased by 180%?). The correct way of combining the two probabilities would be to translate them onto the same scale - the overall chance of death - which would be done by multiplying each value with its probability of happening at all. For example, if the chance of dying from cardiovascular disease was 50% and the chance of being killed by a bear was 0.1%, the overall chance of dying from either would be the sum, 50.1%. Both probabilities are affected by going outside; the new chances are now 50%*0.7=35% and 0.1%*4=0.4% and the combined chance of dying from either is now 35.4% - a significant DEcrease from the original 50.1%.
The specific reference to falling spacecraft is likely inspired by events happening around the time of this comics release (March 2022). Around a month before this was posted, the head of the Russian space agency, Roscosmos, warned that sanctions against Russia (mostly those over the 2022 Russian invasion of Ukraine) could result in the International Space Station crashing. Since the Russian section of the space station is the one that provides propulsion (although it is built to rely on the power generated by the other sections), this was taken seriously and as of when this was posted, NASA was trying to come up with alternative stabilization strategies in case the situation worsened. There was also a recent report of some 600 kg space rocket debris found in Brazil.
Transcript
- [A chart is shown. Above the chart there is a heading, with a subheading below it:]
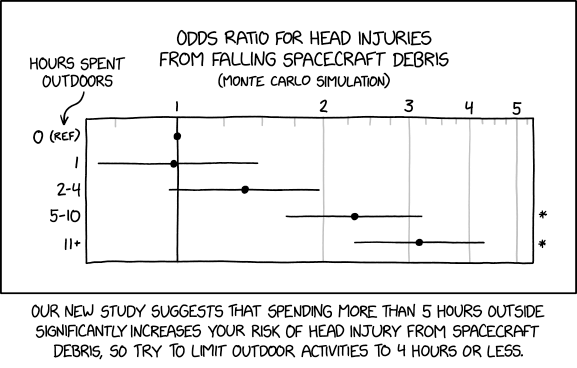
- Odds ratio for head injuries from falling spacecraft debris
- (Monte Carlo Simulation)
- [The chart is rectangular with the X-axis labels above the chart with numbers from 1 to 5. These are places over vertical lines. The first at 1 is black, the other four are light gray. There are three smaller light gray ticks between each set of lines, and one on either side of the first and last. The distance between lines gets smaller and smaller towards the right, probably logarithmic.]
- X-axis: 1 2 3 4 5
- [The Y-axis is not scaled; there are no ticks or lines. Instead it just gives five labels from top to bottom. Above those labels there is an arrow pointing to the top one with a label above explaining the axis.]
- Hours spent outdoors per day
- Y-axis:
- 0 (ref)
- 1
- 2-4
- 5-10
- 11+
- [Aligned with each of these five divisions of the Y-axis there is a dot. The top one is placed on the solid line under 1 as a reference point. The other four dots all have long error bars, with the dots at the center of these. The second dot is a bit to the left of the solid line, with the error bar going almost to the left edge of the graph and halfway to the first light gray line to the right. The third dot is located halfway between the solid and the first light gray line with the error bar just crossing the solid line, and almost reaching the gray line. The fourth dot is about a third way between the first and second of the gray lines, with the error bar crossing both these lines. The fifth and last dot is just past the second gray line, with the error bar crossing both that, going more than half toward the first gray line, and also just past the third gray line. On the same height as the two bottom dots, there are asterisks just right of the edge of the graph.]
- *
- *
- [Below the panel there is a caption:]
- Our new study suggests that spending more than 5 hours outside significantly increases your risk of head injury from spacecraft debris, so try to limit outdoor activities to 4 hours or less.
Trivia
- In the original version of the comic, the Y-axis label said "Hours spent outdoors", but the comic was later changed to specify "Hours spent outdoors per day", which makes more sense. When the updated image was uploaded, it had a much larger size than normal, because Randall posted the same file for both the normal "double size" image and the "regular" size. This had happened before with 2576: Control Group, see that comic's trivia section. This resulted in the problem that the comic broke the boundaries on xkcd.com.
- This comic's title text ("That's a 280% increased") has a typo.
Discussion
correct me if i'm wrong, but i believe 300 - 30 is 270, not 280? 172.68.50.85 22:50, 28 March 2022 (UTC)
- something something percentage points maybe? idk 172.70.134.91 22:56, 28 March 2022 (UTC)Bumpf
- Most likely there is an unstated chance of death by not going outside... presumably ~10% but there's no way to know the breakdown (could be nearly all cardio, could be nearly all ursine if they live in a cave next bears) 172.69.70.127 23:02, 28 March 2022 (UTC)
- 300% increase is multiplying by (1+3), 30% decrease is multiplying by (1-0.3) , %increases are multiplicative so the increase is by a factor of 4*0.7=2.8, which is 280% of the original value (or a 180% increase). 162.158.146.69 (talk) (please sign your comments with ~~~~)
- Yeah, barring a total mistake, that must be where the number came from, but it seems odd by the inconsistent way it is expressed, as it assumes the 300% increase for the bear attack is added to the initial value for a final amount of 400%, along with a similar treatment for the 30% decrease, but the 280% is simply the final value skipping past that step to the conclusion afterwards that is not even shown for the previous numbers. But with the improper grammar, if it's not an actual typo, it may be trying to show the speaker acting dumb or irrational, as it doesn't make sense to end with "increased" instead of "increase" without changing part of the words before that number. Someone thinking that poorly though likely wouldn't be able to multiply things properly to produce that 280% number though.--172.70.130.153 01:13, 29 March 2022 (UTC)
- Joke proof: Assume that every year 400 people are killed by bears in the world, of which 100 are killed inside and 300 are killed outside. Then, indeed, by going outside, the probability that you will be killed by bears increases from 100 to 300: that is 300%. On the other hand, we know that walking outside every day will reduce your risk of death from cardiovascular disease by 30%. Therefore, by walking outside properly, 30% of the above-mentioned 400 people, i.e. 120 people, could in theory avoid death from the said disease, if not attacked by bears. This implies that, even if everyone in the world walked outside every day, only 120 out of the 400 bear attack victims would be potentially saved, while 280 would die anyway. Since by hypothesis only 100 are killed inside by bear attacks, going outside will clearly increase the probability of deadly bear attacks, from 100 to 280: that is 280%. —Yosei (talk) 09:52, 29 March 2022 (UTC)
- As said above, 300% increase and 30% decrease gives a factor ×2.8 which is a +180% increase (not 280%) 162.158.50.176 10:38, 29 March 2022 (UTC)
- It's a joke :) Since the title text is obviously a joke, maybe we shouldn't over-analyze it, except we can enjoy ourselves by “analyzing” it half-jokingly. Seriously, though, there is also some ambiguity in a natural language itself: e.g. by “one-and-a-half times larger than”, one may mean “one-and-a-half times as large as” (150%), or one may mean “150% larger than” (250%). When spoken informally, this kind of ambiguity is not uncommon. Another example would be “five hundred one thousandths” which may mean 501/1000 or 500/1000. Take it easy & take care :) — Yosei (talk) 11:38, 29 March 2022 (UTC)
- This is what I love about XKCD, the jokes come with proofs. Does it depend on what order you apply them in? If you decrease the risk by 30%, you have 70%, then increase it by 300%, you get... 210%? Or 270%? Percentage points vs. percent again isn't it. Why is life so complicated? --192·168·0·1 (talk) 12:46, 29 March 2022 (UTC)
- 300% increase is multiplying by (1+3), 30% decrease is multiplying by (1-0.3) , %increases are multiplicative so the increase is by a factor of 4*0.7=2.8, which is 280% of the original value (or a 180% increase). 162.158.146.69 (talk) (please sign your comments with ~~~~)
- It doesn't really matter because the whole thing is complete nonsense. You can't combine the risks unless you know how big they are relative to each other. Let's say 1,000 people stay inside. 2 are killed by a bear and 10 die of cardiovascular disease - 12 people in total. With the given percentage changes, of 1,000 people who go outside, 8 get killed by bears (300% increase) and 7 die of heart disease (30% decrease), a total of 15. It's more dangerous to go outside than stay in. However, if 250 of the people who stay inside die of heart disease, then we have 252 deaths in total for staying in and only 175+8=183 for going out Jeremyp (talk) 15:33, 29 March 2022 (UTC).
"That's a 280% increased" has a typo/grammaro. The last word should be "increase". Barmar (talk) 23:04, 28 March 2022 (UTC)
- I think the actual typo is the "a" so should be "That's 280% increased" 162.158.146.69 (talk) (please sign your comments with ~~~~)
- In standard American grammar it is much more likely that he meant "That's a 280% increase" than "That's 280% increased." You might say the odds ratio that he meant the former over the latter is 3+.162.158.166.87 15:46, 29 March 2022 (UTC)
Also what's an odds ratio?? ~~Bumpf 172.70.38.41 (talk) (please sign your comments with ~~~~)
- I assume something like "million to one". But the units of the horizontal axis clearly don't correspond to that. I don't know what those units are, they're not a percentage, either. Barmar (talk) 00:40, 29 March 2022 (UTC)
- if you say "this is 4 times as likely" then "4" is the "odds ratio", this is the type of number appearing on the horizontal axis 162.158.146.69 (talk) (please sign your comments with ~~~~)
- An odds-ratio is a way of reporting the results for predictions of binary outcomes. It's a transformation of the (not easily interpretable) regression coefficient. For example, if the OR for "males" (vs females) is "0.70", they're 70% as likely to have the outcome as females; if it's "1.32", then males are 1.32x as likely (equivalently: 32% more likely) to have that outcome as females. 108.162.249.75 Gye Greene
Did something happen to the size of the image after the initial posting? Barmar (talk) 00:40, 29 March 2022 (UTC)
What's with the asterisks on the right side? Jordan Brown (talk) 00:50, 29 March 2022 (UTC)
- I think the asterisks denote that the value at this range is "significant" because its error bars do not overlap with the baseline. If you stay outdoors 5 hours or more in a day, there is a nonzero chance that you will be hit by flying space debris. Laura (talk) 08:15, 29 March 2022 (UTC)
There should probably be an explanation of what "Monte Carlo Simulation" means, as many people who would actually want an explanation of this strip would likely be unfamiliar with that term.--172.70.131.122 01:02, 29 March 2022 (UTC)
- Yes, exactly! I got as far as finding Monte Carlo method via a redirect but have no idea how the bars are supposed to work, what the reference point is supposed to mean, or why the columns get skinnier toward the right. Not dumb, but next to no statistics education. Yngvadottir (talk) 07:51, 29 March 2022 (UTC)
Why is the x-axis of the chart in logarithmic spacing? Any particular reason for this, or is it part of the joke? Captain Nemo (talk) 09:29, 29 March 2022 (UTC)
I wonder if it's deliberate that there's actually less risk if you go outside 1 hour per day. --192·168·0·1 (talk) 12:46, 29 March 2022 (UTC)
Is this covid commentary? Like how everyone got freaked about the odds for covid to the point where they stopped exercising and shutting everyone inside and degrading their mental health? 172.70.131.122 18:26, 29 March 2022 (UTC)
- Odds ratio confusion?
I am very confused by the X axis of this comic, I feel like I must be misunderstanding how this works, but I thought I understood how odds ratios worked. Maybe not. The graph "reads" that "In the reference situation, with zero hours spent outside, the odds ratio for head injuries from falling spacecraft debris is 1.0 ± 0." A 1.0 odds ratio means 1.0:1.0, or that either possibility is 50% likely. That is, there's an even chance your head will be injured by spacecraft debris or that it will not, if you stay indoors. That does not seem like it could be right, so can someone point me to my error? Thanks! JohnHawkinson (talk) 09:34, 29 March 2022 (UTC)
- As best I can tell, this is taking odds as a ratio between any two events. Rather than the usual "success : failure" (or "happens : doesn't happen"), it's "this scenario happens : control scenario happens". By definition, the control scenario is set at 1.0, and something at a ratio of (say) 2.0 is twice as likely to happen. -- Peregrine (talk) 10:50, 29 March 2022 (UTC)
- I definitely think we need to put something explaining what an odds ratio is. But since I feel the need to have it explained, I'm not going to be the one to explain it. --192·168·0·1 (talk) 12:46, 29 March 2022 (UTC)
- I've added an "Odds & Odds Ratios" section to the comic. Does it clear things up? MelodiousThunk (talk) 16:00, 30 March 2022 (UTC)
- I definitely think we need to put something explaining what an odds ratio is. But since I feel the need to have it explained, I'm not going to be the one to explain it. --192·168·0·1 (talk) 12:46, 29 March 2022 (UTC)
- If the guess is correct about the subject being that a possible surprise action by Russia could drop the International Space Station on our heads, or even just its Starlink dish, I think that whether you're indoors or outdoors when its orbit intersects with your coordinates won't affect the risk of head injury. I cannot tell if that's what the chart claims to say. Robert Carnegie [email protected] 172.70.90.145 23:58, 30 March 2022 (UTC)
- Per day
Looks like the comic has been updated to clarify that the number of hours is per day. I'll leave it to someone more experienced with this website to update it, but in any case it makes the note "It is very difficult to avoid being outside for more than four hours in a total lifetime" moot. 172.70.114.147 12:31, 29 March 2022 (UTC)
- I uploaded the new version that includes "per day" in the y-axis label. But the image size also changed, now the image is the normal _2x size. I'm hoping that will get fixed eventually, like it did for 2576: Control Group. Orion205 (talk) 22:42, 29 March 2022 (UTC)
- Monte Carlo Tree Searches
MCTSs are one of those things that don't seem like they should work but they do Beanie talk 20:55, 29 March 2022 (UTC)
- I just did my own Monte Carlo Tree Search and... there's definitely at least one, jutting up into the bottom/right of that overview. :-p 172.70.91.36 22:37, 29 March 2022 (UTC)
- Image scaling off
Does anyone else experience a problem with the scaling of the comic image? It is not fitting to the frame, but displays on full size on the web page. It only happens for this comic, not other ones, and i see it both on the main page as the xkcd/2599 page. Some mistake for sure, but I have not seen this before. Screenshot proof: imgur link Flekkie (talk) 22:32, 29 March 2022 (UTC)
- This happened back in 2576: Control Group. It was fixed after about a week. Orion205 (talk) 22:42, 29 March 2022 (UTC)
The error with the really big image is still present for me. 172.69.90.77 14:24, 30 March 2022 (UTC)
x-axis of the chart in logarithmic spacing
First timer here, please forgive me if a new discussion subject is inappropriate for the x-axis of the chart being in logarithmic spacing, but I think this warrants considerable discussion by itself (a) because it is a major visual element of the comic, (b) it has received only brief attention to date in explainxkcd discussion.
My thoughts:
I am not a statistician. Odds ratios in medicine are usually expressed in a linear manner. Thus, the logarithmic scale for the x-axis is curious. But given the underlying probability of being hit by space debris approaches an asymptote of a near-zero actual probability, perhaps a logarithmic scale is simply correct? It is clearly a deliberate design element, and one that is a major part of the comic.
So those more skilled in stats and explaining xkcd humor will add a few sentences on this matter to the main description! Speculation - perhaps logarithmic is "accurate" within the nonsense assumptions, and so there for consistency? Or perhaps it is a deliberate (by Randall) additional "error" (by the supposed "authors" of the study), and thus the presence of a logarithmic scale compounds the nonsense, as it were, exponentially?
- Linear correlation?
I'm wondering how the correlation between time spent outside and chance of getting hit could be anything other than linear. If 1 hour outside gives you X probability, surely 2 hours outside would be 2*X probability. FishDawg (talk) 05:37, 7 April 2022 (UTC)
- Sort of, but probabilities don't exactly behave like that. On that analysis, given enough time outside, the probability would pass 1 and keep on rising. But a probability of 1 is absolute certainty, so probabilities higher than that are meaningless. I believe the comic is consistent with your assumption that the rate is constant -- the probability of getting hit during an hour is the same no matter which hour it is. It seems reasonable to me, too. Then after 1 hour, your probability of remaining unhit is 0.999999999 or whatever. After 2 hours, it's the probability of remaining unhit in the first hour times the probability of remaining unhit in the second hour, 0.999999999^2. After 3 hours, it's 0.999999999^3, and so on. So the probability of *ever* getting hit actually follows an exponential curve. 108.162.245.173 16:32, 8 April 2022 (UTC)
- (I mean, the rate might not be constant not on a time scale of decades or more. You could go from a society that can't launch spacecraft at all to launching a few and then many, or from a society that just lets 'em fall to one that takes responsibility for moving large pieces into a parking orbit or a controlled deorbit, or from a society that takes responsibility to a charred ruin pocked with circles of radioactive glass, or from that to the rise of Atlantean mages from the tunnels of Shambhala whose mana shall deorbit all things, as the History Channel hath prophesied. But anyway.) 108.162.245.173 16:33, 8 April 2022 (UTC)
So much confusion about the comic and the explanation read like a bunch of individual comments on top of each other. I took the liberty of rewriting the whole thing (actually, I just wanted to explain Monte Carlo simulations better but then things escalated). I'm fairly certain that I understand the joke of the comic - Randall was simply cramming as much misuse of statistical methods as possible into one "study". The explanation is now rewritten in a pattern of "method->what method is used for->how it's misleading here". I'm still not happy with all the details, but I hope the explanation as a whole makes more sense now and that I managed to write understandably. Rebekka (talk) 05:27, 1 July 2023 (UTC)
